Using National Audit Data for Service Improvement
Examples from teams in the Yorkshire and Humber Neonatal Network, Bradford Teaching Hospitals and Manchester University NHS Foundation Trusts using data from the National Neonatal Audit Programme to improve quality of care.
Improving Achievement and Documentation of Parental Consultation Within 24 Hours of Admission
Newborn Intensive Care Unit, St. Mary’s Hospital, Manchester University NHS Foundation Trust
Background
We have struggled to achieve required standards in providing and documenting senior clinician updates for parents in the first 24 hours of admission. In 2018, the National Neonatal Audit Programme (NNAP) reported us at 81% vs national average of 95.9%. We deemed the problem to be multi-factorial, related to: high turnover of babies and doctors; transition of babies from room to room; change in NNAP standard which excluded Tier 1 Advanced Neonatal Nurse Practitioners (ANNPs) from communications; switchover to electronic patient records with resultant documentation challenges. The aim of the project was to raise awareness of the issue, improve quality of parental discussions and documentation, and to reach (and ideally surpass) the national average.
Stakeholders
NNAP team, Neonatal Consultants, senior clinical fellows and trainees, senior nursing staff, and our Neonatal Intensive Care Unit (NICU) parents.
Measures:
With our audit facilitator emailing daily any outstanding parental updates, and a monthly visualisation of NNAP parameters on the NICU dashboard, we have been able to follow improvements closely.
Our improvement plan:
By discussing outstanding updates at handovers, making parents aware that they should have a senior update soon after baby’s admission and involving the ‘Room Lead’ nurse in the process, there were frequent reminders and prompts. Circulating monthly data on individual consultants’ success has had a positive effect on communication and documentation, introducing an important element of competition.
Barriers to success included:
- nuances in our electronic patient records (EPR) leading to suboptimal documentation
- occasional language barriers
- availability of senior doctors to give updates out of hours
- keeping consultants engaged in the project
We have overcome these barriers by making tweaks to our EPR communication tabs, increasing our use of ‘BigWord’ – targeted daily consultant emails, introduction of a “twilight” registrar shift, and the publication of the Consultant Leader Board.
Outcomes
We were delighted to see that expected Q1 2020 NNAP data sees us at 95.1%, above the national average of 94%, and in keeping with the expected 93% for 2019. We are confident that the results reflect our commitment to providing timely, high-quality updates for parents of our NICU babies. We will work to sustain the improvement, keeping all above measures in place.
Challenges, learnings and top tips for implementation
As this QI project has been very successful, we would not do anything differently were we to do it again, and would be happy to share our story and interventions with other units facing similar challenges.
Dr. Kristin Tanney (Clinical Lead), Dr. Sajit Nedungadi (NNAP Lead), Dr. Ngozi Edi-Osagie (Clinical Head of Division, Newborn Services), Ms. Kath Eaton (Lead Nurse, Newborn Services), Mr. Marc Hutchison-Saxon (Neonatal Critical Care Audit Facilitator), Mrs. Chris Ashworth (Divisional Director, Newborn Services)
Originally published in the NNAP Annual Report 2020
Ward Clerks as Agents for Change:
Improving Documentation of Parental Conversations
Neonatal Unit, Bradford Teaching Hospitals NHS Foundation Trust
Background
Measuring the change in rate and documentation of parental conversations within 24 hours of admission after ward clerks were included in the morning safety huddle to brief the team on whether the parents of newly admitted babies had been consulted.
In the 2019 NNAP audit data, our unit had been a negative outlier in documenting senior parental consultations within 24 hours of admission. Our attempts to improve this by consultant feedback, by dissemination in our “weekly learning” poster and by reinforcement with trainee medical and ANNP staff had been unsuccessful. Rotating medical staff made achieving consistency in ensuring these conversations occurred and were documented to the high standard we aim for, was challenging. We had already implemented a data cleaning process, albeit retrospective.
Our challenges were exacerbated by the pandemic with visiting restrictions and parental sickness affecting parental presence. The trend in how successful we were in documenting these conversations also, loosely, tied in with the 6-month intervals when junior staff rotate. Although the trend improved as staff learned to consult and document their conversations, we felt a need for consistency to compensate for changing staff.
Stakeholders in this process included parents, trainee medical staff, ANNPs, consultants, trust management and our ward clerks. Our ward clerks have been able to champion the success of this change and as a side benefit now have a more active role in our morning safety huddle.
Measures
In order to measure the success of this change, we have been monitoring the NNAP data generated on our system at monthly intervals. We have also been able to measure this in real-time as ward clerks brief us of the new admissions and if consultations have been documented each morning. This provides opportunities for early remediation.
Our improvement plan
Our improvement plan is illustrated in Figure 1. Our ward clerks were included in our morning safety huddle and now have a designated role: to highlight how many admissions have occurred in the past 24 hours and whether parental conversations have been documented on BadgerNet. This has ensured that each morning there is a reminder to do so and a safety-net to allow these conversations to still take place within the 24-hour standard.
This has led to a nearly 100% success rate since our ward clerks have championed this. In the 6 months prior to this intervention, 93.1% of parents were consulted within 24 hours. In the six months after, the average was 98.5% and once this change idea was suggested, we experienced no barriers to this change.
Figure 1 – Ward clerks attending morning safety huddle:

Outcomes
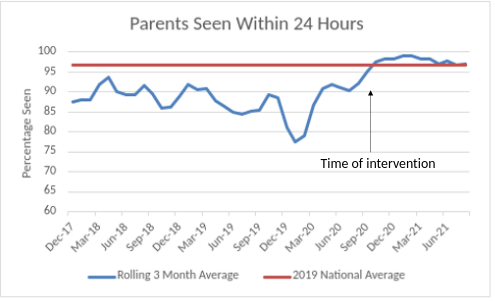
- Since introducing this measure we have been achieving a success rate of 95% and above- with many months at 100%. Historically, we had been achieving as low as 67% and never had we achieved 100% within the past 3 years. Figure 2 illustrate this improvement.
- We believe that parental partnership in care begins early and find that a first conversation can be very important in shaping how parents experience their baby’s care. “It’s been brilliant having real time feedback of how we are doing on this measure” – Consultant Neonatologist, Bradford
- We feel this change will be self-sustaining. Even when our ward clerks are on leave, the huddle prompt is quickly addressed – although typically communication has already been encouraged by the presence of this failsafe.
Figure 2 – Percentage of parents consulted as rolling 3 monthly average compared to national average (NNAP 2019 data):
Top tips for implementation
There were no challenges or learning arising from the project.
We have found this is a really simple method to ensure the whole team is aware of parental consultations and our ward clerks have taken an even more active role in the neonatal unit. We suggest you give it a try!
Authors: Dr Catriona Firth, Dr Jonathan Reeves, Dr Izzati Abd Wahab
Published as part of the NNAP Annual Report on 2020 data
Do All Low Gestation Babies in the Network Receive All of the Appropriate Early Interventions Identified Locally as the ‘Big 5’?
Yorkshire & Humber Neonatal Operational Delivery Network (ODN)
Background
To determine whether individual low gestation babies receive five core early care interventions, and provision of the ‘Big 5’ impacts on outcome/mortality as well as providing a focus for future QI projects.
Historically, the provision of individual clinical interventions has been reviewed in isolation; to date reviewing interventions at baby level hasn’t been performed.
The network wanted to understand whether units achieving high rates of provision for one element of care did so for all, or whether in fact concentrating on one element to improve their rate of achievement meant that it was at the detriment of other elements of care.
Reviewing whether each low gestation baby receives the ‘Big 5’ is identified as:
- Delivery in appropriate location for gestational age
- Antenatal steroids
- Maternal Magnesium Sulphate
- Physiologically-based cord clamping
- Normothermia on admission
All measures were based on NNAP criteria apart from Deferred Cord Clamping (DCC) as that was not a measure when this work was commenced, but has subsequently been brought in line with the NNAP criteria for DCC.
Measures:
A retrospective review of ‘Big 5’ data from BadgerNet from all 18 units in the Network, for all infants born <32 weeks. Data collated by the ODN with unit level summaries and network level, unit comparisons, to review the number of babies receiving 100% provision of the ‘Big 5’.
A quarterly review of the data at unit level, as well as unit type, Local Maternity System (LMS) footprint & Network overviews are provided.
The initial phase of the project was to determine what the baseline for the provision of the ‘Big 5’ was. Review and discussion has taken place around the ‘weighting’ given to some elements and whether there should be ‘grades’ of compliance. These continue to be reviewed.
Our improvement plan:
The main change that this project has brought about is the focus on the baby rather than the individual elements of care.
Outcomes
This alternative approach to reviewing quality of care in individual babies is already contributing to improving working relationships between obstetric and neonatal services. Presenting the data in a relevant & easy to digest format supports clinicians to take responsibility for the care they provide by reporting meaningful and measurable metrics which can be linked to outcomes. There is scope for further extensive data review which will be used to direct QI initiatives both at Unit and Network level to improve clinical outcomes.
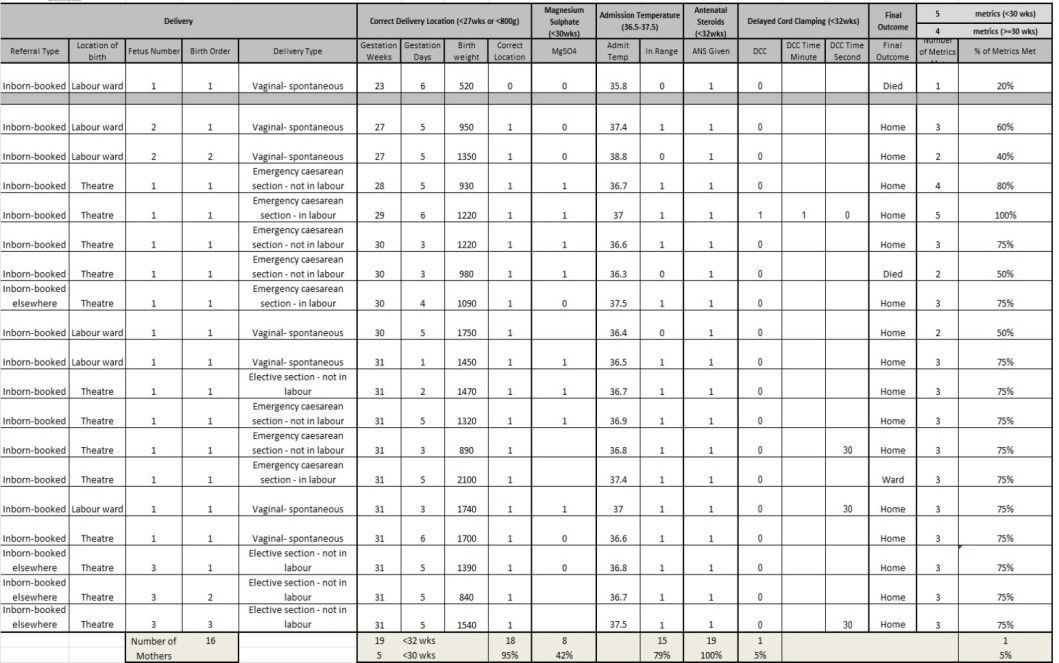
Initial results from Q1 19/20 data demonstrated that only 17% (32) of cases across the Network had 100% provision of the ‘Big 5’.
- In NICUs the range was from 0% (0/23) to 38% (10/26)
- In Local Neonatal Units (LNUs) the range was from 0% (0/9) to 33% (1/3)
- In Special Care Units (SCUs) all of the 4 units achieved 0%
Deferred cord clamping was the most common reason for not achieving the ‘Big 5’ at all unit levels. If DCC is not factored in compliance ranges from 0% to 100% with the mean being 47%.
By Q4 19/20 the data demonstrated that there have been improvements at NICU level but that other unit types are not seeing such significant changes.
- In NICUs the range was from 19% (3/16) to 52% (14/27)
- In LNUs the range was from 0% (7 units) (0/9) to 22% (2/9)
- In SCUs all 4 units achieved 0% – they will never achieve 100% though as none of these babies should be delivered in a SCU setting. However one unit did achieve all of the other criteria for the 2 babies that they admitted and in previous quarters the unit had achieved 0% and 50%.
DCC continues to be one of the main factors contributing to units not achieving the ‘Big 5’. It is clear that there is still a considerable way to go before we see the Big 5 being achieved for all babies.
It is hoped that continual monitoring along with the introduction of the DCC question in the NNAP audit will help to improve this, both in terms of change in clinical practice and as well as data recording.
Further work will be focused on:
- Refining the reporting process and feeding back to maternity and obstetric colleagues via the LMS
- Reviewing if type of delivery or location of delivery impacts on receipt of ‘Big 5’
- Reviewing final outcomes in relation to receiving the ‘Big 5’, specifically relating to bronchopulmonary dysplasia & mortality
- Reviewing the impact of increased provision of DCC and its introduction into the NNAP dataset
A sample of a unit level summary is pictured below:
Charlotte Bradford, Senior Information Manager
Originally published in the NNAP Annual Report 2020
Using NNAP Data in Peer Review Visits
Yorkshire & Humber Neonatal Operational Delivery Network (ODN)
Background
Our networks have a significant history of network facilitated, data based, unit delivered quality improvement activities, such as changes in practices related to hypothermia which have resulted in important improvements in admission temperatures.
What we did
- During 2016 the network team have been visiting all the units in the Yorkshire and Humber Neonatal Network to carry out a multi-professional peer review.
- During preparation for the visits the network pull together a wide range of available data from external sources such as NNAP together with our own regional data.
- The units complete the pre-visit metric with locally held data e.g. on staffing.
- The network then visit with a multidisciplinary team including our data analyst, manager, lead clinician and nurse together with our regional BLISS worker representing a parent.
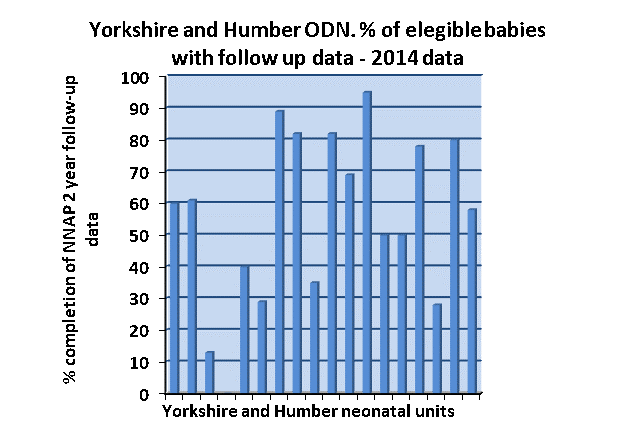
- We were aware from the NNAP data that, although our ODN had higher than aggregate rates of follow-up reported by NNAP in 2015, we had very variable levels of completion of 2 year follow up and used this as one the key metrics (Figure 3). The data has been very helpful to individual units in reflecting on what has gone well in their follow up plans and in discussing what needs to go ‘even better’.
Figure 3 – Percentage of eligible babies in the Yorkshire and Humber ODN with follow-up data in 2014:
Results
The peer review visit covered a wide range of issues using all the key areas of the neonatal service specification as the framework for assessment – it has been invaluable to have some good data on how other units perform to use as a benchmark. We have previously used the same data sources to address other issues e.g. temperature on admission with documented significant improvement although more remains to be done.
We and the network units will be looking closely at all the metrics in future NNAP reports, much as we regularly review other aspects of service delivery, and hope a spirit of healthy competition will see Yorkshire and Humber units moving up to being among the best performers.
Dr Chris Day, Consultant Neonatologist and Clinical Network Lead
Originally published in the NNAP Annual Report 2016